Introduction
Are we healthy eaters at INPS?
Introduction
Many surveys tell us that young people are not eating healthy. Is this true at INPS? Are we just like everyone else or are we doing better or maybe worse?
Task

Your task is to survey INPS 4,5 & 6 students , compare their eating habits with the NSW Schools Physical Activity and Nutrition Survey (SPANS) and write a report showing your findings.
Process
Step 1: Background Information ~1 ICT session.
Before we can compare our students we need to understand what is healthy eating and why is it such a big deal.
Collect the Background Information worksheet and use it to record what you already know about healthy eating and why it is important.
Then research following the links below.
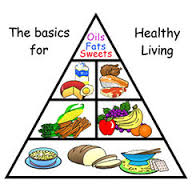
- What is healthy eating?
http://www.nutritionaustralia.org/national/resource/healthy-living-pyramid#.U92X1uOSybM
http://www.healthyactive.gov.au/internet/healthyactive/publishing.nsf/Content/materials
- Why is it important to eat healthy?
http://www.healthyeatingaustralia.com/benefits-of-healthy-eating/#sthash.S88Np2FW.dpbs
http://www.getontrackchallenge.com.au/benefits/benefits-of-a-healthy-lifestyle/
http://www.nutritionstyle.net/benefits-of-healthy-eating-for-teenagers/
Step 2: Survey Students
Collect the Food Diary and Food Servings information and complete for one week. Make sure the other class are filling it out too.
Choose one member of your class to explain what and why you want them to fill out the diary. Remind them to be honest so we get true results.
 Step 3: Record survey information
Graph 1 ~ Extra foods ~ 2 ICT session
- Open Excel, call this page Extra Foods
- Write the following headings down the first column
Confectionary, Soft Drink/ Cordial, Hot Chips, Potato Chips
- Write the following headings across the first row
Daily, 4x a week, 2x a week, Once a week, None
- Record findings from food diaries
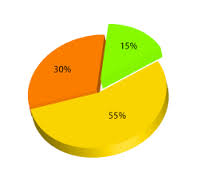
- Make as a percentage pie graph
- Cut and paste graph into a Word Doc. Name it INPS Healthy Eating Survey
- Write down what you see?
- Remember to save
Graph 2 ~ Number of serves~ 1 ICT session
- Open previous Excel file
- Open a new page and call it Number of Serves per Day
- Along the top line write the 5 food groups
- Down the first column write the number of serves per day
1 2 3 4 5 6
- Record findings from food diary - you will need to average out servings from the week
- Make as a percentage pie graph
- Cut and paste graph into INPS Healthy Eating Survey file
- Write down what you see?
- Remember to save
Graph 3 ~ Eating Habits ~ 1 ICT session
- Open previous Excel file
- Open a new page and call it Eating Habits
- Along the top line write the headings
Skips breakfast, Eats Dinner in front of TV
- Down the first column write
Boy, Girl
- Record your findings from the food diaries
- Make as a percentage pie graph
- Cut and paste graph into INPS Healthy Eating Survey file
- Write down what you see?
- Remember to save
Step 4: Compare ~ 1 ICT session
- Collect the Question Sheet from the teachers and read the following page and fill it out.
http://www.healthykids.nsw.gov.au/stats-research/healthy-eating.aspx
- Now go back to our graphs. Collect the INPS Survey Results sheet and fill it out .
Evaluation
Healthy Eating Web Quest
|
|
1 |
2 |
3 |
4 |
Total |
|
Back ground information |
Recorded own prior knowledge and 1 or 2 pieces of information |
Recorded own prior knowledge and 3 or 4 pieces of information |
Recorded own prior knowledge and 5 pieces of information |
Recorded own prior knowledge and 6 or more pieces of information |
|
|
Food Diary |
Recorded 1 day of food diary or use very little detail |
Recorded 3 day of food diary |
Recorded most days of food diary in detail |
Recorded all days of food diary in detail |
|
|
Extra Foods Graph |
Completed graph with no headings and spelling mistakes |
Completed graph with a few spelling mistakes and a simple explanation |
Completed graph with no spelling mistakes and a simple explanation |
Completed graph with no spelling mistakes and a detailed explanation |
|
|
Number of serves Graph |
Completed graph with no headings and spelling mistakes |
Completed graph with a few spelling mistakes and a simple explanation |
Completed graph with no spelling mistakes and a simple explanation |
Completed graph with no spelling mistakes and a detailed explanation |
|
|
Eating Habits Graph |
Completed graph with no headings and spelling mistakes |
Completed graph with a few spelling mistakes and a simple explanation |
Completed graph with no spelling mistakes and a simple explanation |
Completed graph with no spelling mistakes and a detailed explanation |
|
|
SPANS survey & INPS survey |
Answered 10-12 questions correctly |
Answered 13- 18 questions correctly |
Answered 18 questions correctly |
Answered all questions correctly |
|
|
Conclusion |
Answered 1 or 2 questions in simple sentences and with some spelling mistakes and limited formatting |
Answered most questions in sentences and with 1 or 2 spelling mistakes and clear formatting |
Answered all questions in sentences and with no spelling mistakes and clear formatting |
Answered all questions in detail and with no spelling mistakes and clear formatting |
|
Conclusion
 Step 5: What did you find out?~ 1 ICT session
In the Word Doc. with graphs begin a new page with the heading Conclusions
Answer the following questions;
- Are the students at INPS eating healthy compared to the NSW Schools Physical Activity and Nutrition Survey (SPANS)? Explain
- What were we good at?
- What are the areas for improvement?
- What would you recommend we do to improve the healthy eating habits of INPS students?
Print your INPS Healthy Eating Survey file and give to the teacher