Introduction
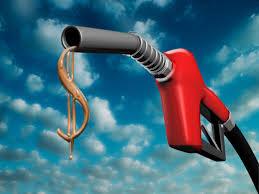
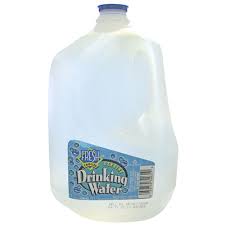
Have your students considered that gasoline might be a bargain when compared with the price of other liquids they consume? Take bottled water, for example. A 16-ounce bottle of water costing $1.09 works out to $8.72 a gallon. That makes gasoline look like a real bargain! Of course, buying a gallon of water is usually cheaper than buying eight 16- ounce bottles of water; but for the purpose of illustration, the bottled water example puts the cost of gasoline in perspective.
Involve students with the use of technology to:
1. Compare different themes with their country with others.
2. Learn how to create graph using a website.
3. Develop analysis of data.
Task
Students create charts comparing the cost of a gallon of gasoline to gallons of other liquids mouthwash, house paint, fruit juice, and white-out, for example.
Calculate, COLA, cost of living, economics, equation, gallon, gasoline, inflation,liquid, measure, measurement, pint.
Students will
1. Research the cost of a gallon of gasoline.
2. Calculate the costs of gallons of a variety of liquids.
3. Create charts showing the data they collect.
4. Discuss the data.
5. Use software or a free online tool to create graphs comparing the costs of a
gallon of gasoline with that of five other liquids.
Process
|
Students can do this activity individually or in small groups, in class or for For student with accomodations: 1. Make the table with four columns: Liquid Product, Cost of Item, Size (Volume) of Item, Price per Gallon. 2. Look and save photos of the products of different countries with the prices. |
Evaluation
1. See if the charts are done such it is written in the instructions.
2. Compare the data in the chart with the graph, to check if it has the same information.
3. Students should make an analysis of their results, specifying with country have the products with less cost.
Conclusion
Students should be able to complete the chart and make a graph with the obtained data.
Credits
References:
Hopkins, Gary. And You Thought Gasoline Was Expensive! [ONLINE] Available
at: http://www.educationworld.com/a_lesson/02/lp265-01.shtml. [Last Accessed
April 24, 2015]
Hopkins, Gary. And You Thought Gasoline Was Expensive! Create a Graph.
[ONLINE] Available at: http://nces.ed.gov/nceskids/createagraph/. [Last
Accessed April 24, 2015]
Teacher Page
Damaris Joubert
University of Puerto Rico
Campus of Rio Piedras
Mathematic Education