Introduction
INTRODUCTION
This web quest will give opportunity to learners to use variety of tools to discover information about the heating curve of the water.They will explore through variety of activities the phase changes from ice to steam. It is designed for grade IX learners. The main objectives of the lesson are:
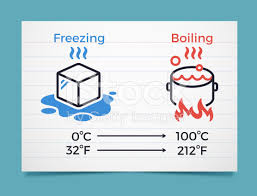
- Differentiate between freezing, melting and boiling.
- Construct a line graph to show heating curve of water.
Task
Task:
You are about to explore that energy exchanges are not changes in kinetic energy. They are changes in bonding energy between the molecules. If heat is coming into a substance during a phase change, then this energy is used to break the bonds between the molecules of the substance. The example we will use here is ice melting into water.
For this you will be:
- Exploring the information from the webpages.
- Watching the videos/animations
- Drawing your heating curve from the data collected from the lab activity.
- Making short photostory of the phase changes of the water.
 Finally, completing the online quiz to see how much you have learnt.
Enjoy and have fun with . Best of Luck!
Process
Process
Follow the instructions carefully.
- First watch this video:
https://www.youtube.com/watch?v=VZ0QjUs9ZO8
- Now use your data from lab activity to create online "Line Graph" by using the following website:
- Copy the link and paste on EDMODO.
(You can use Word Excel if it is difficult for you.)
- Use your photographs of the experiment to create photoshow by using this site.(Four to six photographs).Share the link on EDMODO
 Finally see this animation and complete the quiz and screenshot the result for sharing on EDMODO.
http://www.bbc.co.uk/schools/scienceclips/ages/9_10/changing_state_fs.shtml
Evaluation
Evaluation
Indicator#1: Understanding of the heating curve and various changes involved in conversion of the ice into vapours.
Excellent: The learner shows complete evidence of understanding of the phase changes involved in conversion of ice into vapours.
Very good: The learner shows evidence of understanding of the phase changes involved in conversion of ice into vapours but not being advance in the concept.
Good: The learner shows some evidence of understanding of the phase changes involved in conversion of ice into vapours but not enough to be proficient.
Satisfactory: The learner shows no evidence of understanding of the phase changes involved in conversion of ice into vapours.
Indicator#2: Interpretation of the collected data in the form a correct line graph and short photo story.
Excellent: The learner drew perfect line graph from the data collected and arranged photos in sequence to show the changes.
Very good: The learner drew line graph from the data collected with little variation and arranged photos in sequence to show the changes.
Good: The learner drew line graph from the data collected but showed incorrect placement of the values and arrangement of photos to show the changes
Satisfactory: The learner drew line graph from the data collected but showed many flaws in the placement of the values and could not arrange photos properly.
Indicator#3: Quiz
Excellent: The learner answered all questions correctly.
Very good: The learner answered almost all questions correctly.
Good: The learner answered some correctly.
Satisfactory: The learner answered none of the questions correctly.
Conclusion
CONCLUSION
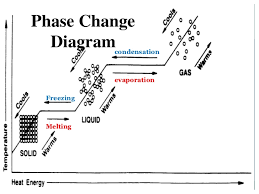
A substance must absorb heat energy so that it can melt or boil. The temperature of the substance does not change during melting, boiling or freezing, even though energy is still being transferred.
A heating curve is a graph showing the temperature of a substance plotted against the amount of energy it has absorbed. You may also see a cooling curve, which is obtained when a substance cools down and changes state.
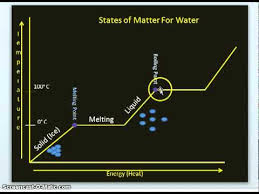
A heating curve for ice
Notice that the temperature stays the same during a change of state, melting or boiling, even though heat energy is still being absorbed.
The temperature also stays the same while a liquid freezes, even though heat energy is still being released to the surroundings.
Credits
CREDITS
Video for watching
https://www.youtube.com/watch?v=VZ0QjUs9ZO8
To create online graph
For organizing photos to chare
Watch and complete quiz
http://www.bbc.co.uk/schools/scienceclips/ages/9_10/changing_state_fs.shtml
Teacher Page
TEACHER'S PAGE
An interesting property of matter is that its temperature will remain constant during a phase change, assuming its surrounding pressure is constant.
In other words, once the temperature of a liquid reaches its boiling point, the temperature will not increase until all the liquid has changed its phase to become a gas. Likewise, once the temperature of a liquid is lowered to its freezing point, the temperature will not decrease until all the liquid has changed its phase to become a solid. A similar effect occurs in the opposite direction..
Solid/Liquid/ transition
With ice, some of the molecules will break lose from the solid state and turn into water molecules as the material is heated. But when they do change, they take energy from the ice, thus keeping its average temperature of the ice at or below freezing. The temperature of the ice will remain near the freezing point until all of the molecules have changed their state to become liquid. Then the temperature of the liquid will increase as heat is added.
Changing liquid to solid
The opposite effect occurs when you cool a liquid to change its phase to a solid. Collections of liquid molecules will gather to form solid particles. That transition slightly increases the temperature or average KE of the liquid, which will remain at a temperature near to the freezing point until all the liquid has turned to the solid phase.
Thus water will remain at or near the freezing point until all the material has crystallized into ice. Then the temperature of the ice can start to decrease.
Liquid/gas transition
Sufficiently heating a liquid can cause it to become a gas. Likewise, cooling a gas can turn it into a liquid.
Changing liquid to gas
When a liquid—such as water—is heated at a constant pressure, some of its molecules get enough KE to escape the liquid. However, when the high energy molecules escape, they slightly lower the average energy of the liquid.
You can experience the lowered temperature when water evaporates into gaseous molecules.
Thus, more heat energy is needed to cause other molecules to escape. This keeps the liquid at a temperature slightly below that of the boiling point. Once all of the molecules have enough energy to escape into the gaseous state, the temperature of the gas can increase.
Changing gas to liquid
The opposite effect occurs when you cool a gas to change its phase to liquid. It will remain at a temperature near to the boiling point until all the gas has turned to liquid.
EACHER'S PAGE