Introduction
Yellowstone National Park was America's first National Park, established in 1872. It is a magical place full of grand canyons, boiling mud, colorful hot springs, and majestic wildlife. 3.8 million people visit this wonderland every year!
You have been selected to be a wildlife biologist intern. Wildlife observation is one of the most popular activities that visitors experience in the park. It is your job to collect valuable data on the animal population to help people plan their trip. One of the secrets to spotting wildlife is to know where to look. Have fun in the field!
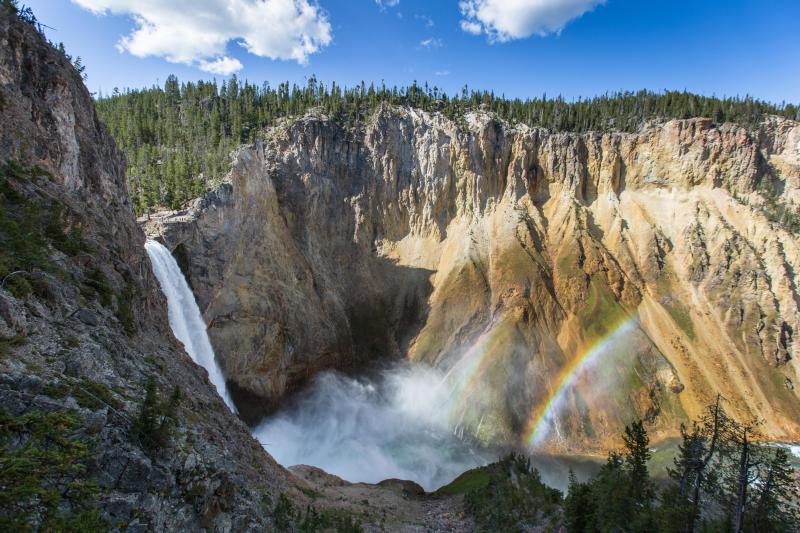
https://www.nps.gov/media/photo/gallery.htm?id=066424D2-1DD8-B71B-0BC78C27A92AF323
Task
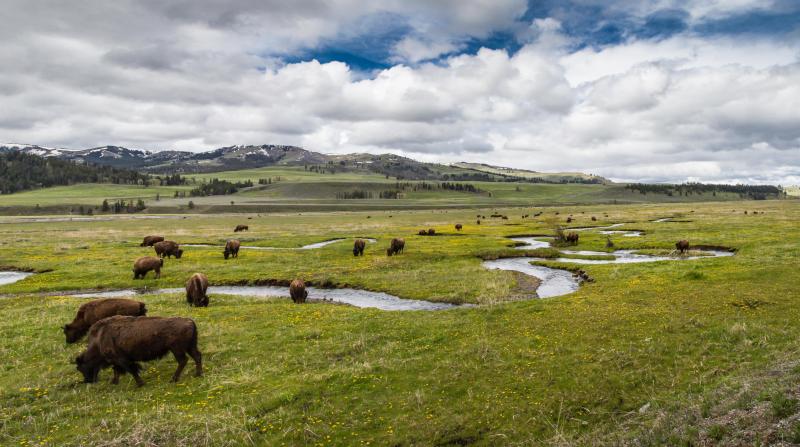
Your task is to conduct research on the animal populations in Yellowstone National Park, You will use those statistics to help students like yourself learn the likelihood of spotting majestic wildlife when they visit.
https://www.nps.gov/media/photo/gallery.htm?id=9A1CF622-1DD8-B71B-0B186131F9E0AD4D
Process
1) Create groups of 3-4 wildlife researchers, and grab a chrome book.
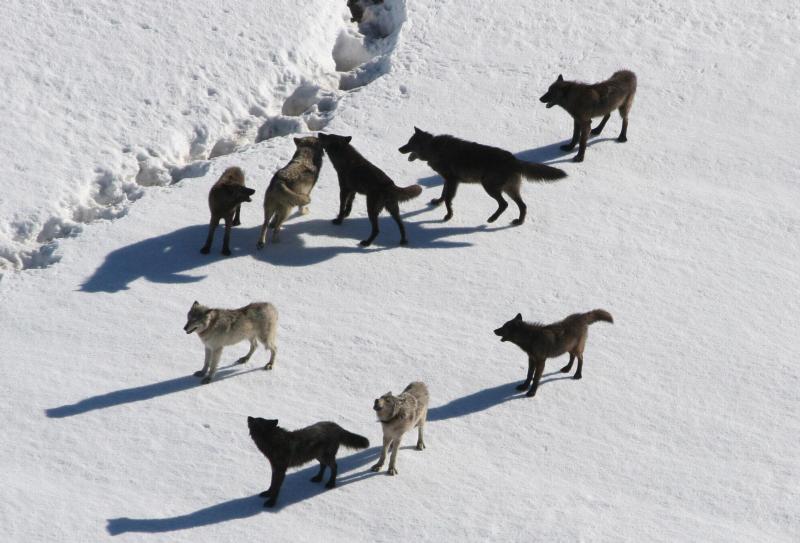
https://www.nps.gov/media/photo/gallery.htm?id=25C97BD8-155D-451F-675E208BE082FE26
2) Go to this website to find the population of wolves:
https://www.nps.gov/yell/learn/nature/wolves.htm
3) Go to this website to find the population of grizzly bears:
https://www.nps.gov/yell/learn/nature/grizzlybear.htm
4) Go here to find information on Elk
https://www.nps.gov/yell/learn/nature/elk.htm
5) Here is information on Bison
https://www.nps.gov/yell/learn/nature/bison.htm
6) Now that we have some data, next let's review how to make a bar graph.
7) Using the data you collected, create a bar graph on a separate sheet of graph paper. Remember to use a straight edge!
8) Title the x- axis with the independent variable, Species, and assign a number to each species (ex. Wolves = Species 1, etc.)
9) Title the y-axis with the dependent variable, Animal Population.
10) Using the bar graph, answer the following questions:
a) What species has the highest population in the park?
b) What species are we least likely to see?
BONUS: What would happen if the wolves went extinct in the park?
Conclusion
1) Did this activity help you understand how to create an effective bar graph, and why?
2) Have you been to Yellowstone National Park? If yes, what was your favorite part of your trip?
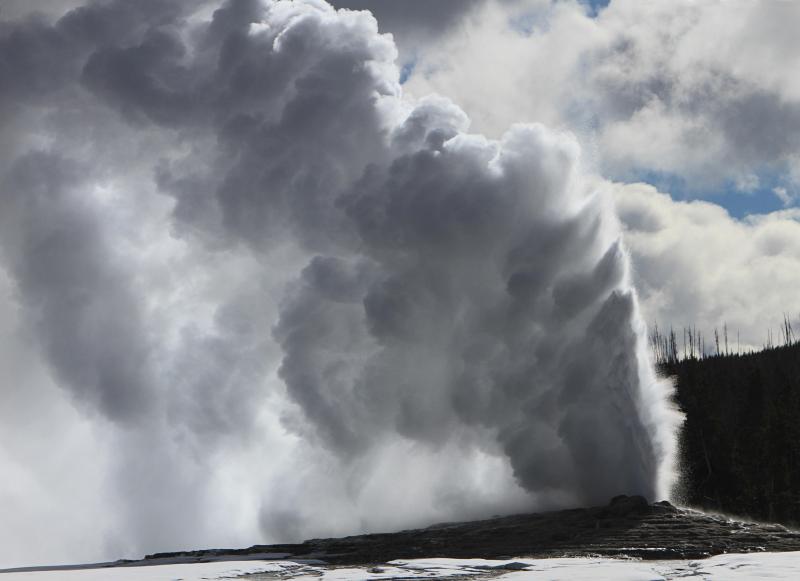
https://www.nps.gov/media/photo/gallery.htm?id=DEA61871-1DD8-B71B-0B475E2493541F16