Introduction
Watch me introducing the project or read the text below.
GOOD LUCK!!!!!
http://screencast-o-matic.com/watch/coiZ3EfvVp
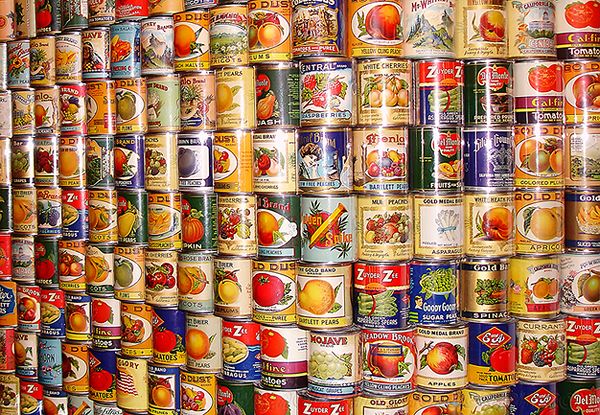
On the shelves of the store in the caned vegetables and canned fish area there are a lot of types of cans. The manager of the company that produces canned vegetables situated in our city is thinking: “We have seven different types of cans – some cans are big, others are small; some are thin and tall and others are short and wide.
How can we optimize the cans so they are using the smallest amount of material using the same volume?”
This is the question that the manager is asking himself in order to solve the can problem.
Task
 SO THE TASK IS
Write a report of what you noticed and your conclusions.
For this:
FIRST CLASS
The students will be given 5 types of cans to build from paper or cardboard
The questions the students have to answer in the first lesson are related to the characteristics of cans that are important, the formula of the volume of the cans, density of the air inside the cans.
The next step is to ask the students to build other cans with different radiuses and height to have a feeling of what they are looking for.
SECOND CLASS
The students will have to respond questions about the area of a rectangle, area of a circle, surface area of a cylinder. The students will have to create a spreadsheet where they will write the radius, height and calculate the volume for all the types of cans given at the beginning plus any other cans that were made at home.The students will have to analyse the spreadsheet with all the cans they found that have the same volume as the first 5 types (or very close to it). Then they will have to analyse the volume of the cans, the lowest surface area between all the cans with the same volume, and then represent the graph between the radius and the surface area of the cans with the same volume.
THIRD CLASS
The regression analysis will be introduced. The regression analysis will be used in order to find the ecuation of the graph of surface area in terms of the radius of the cans for ten samples.
The slope concept will be reviewed. The rate of change and the average rate of change and stationary values will be introduced.
For what radius the surface is the smallest and what do you notice regarding the relationship between the radius and the height for the smallest surface area will be the last questions.
Process
 FIRST CLASS
The students will be given 5 types of cans to build from paper or cardboard
The dimensions of the cans are:
Type 1: radius = 6.50 cm; height 10.25 cm
Type 2: radius = 6.00 cm; height 12 cm
Type 3: radius = 5.50 cm; height 14.25 cm
Type 4: radius = 4.8 cm; height 18.75 cm
Type 5: radius = 4.10 cm; height 25.7 cm
The questions the students have to answer in the first lesson are:
- What do you think is the shape of a perfect can?
- What physical characteristics are important for the cans?
- Is the amount of metal important?
- What is the volume of the cans?
- Watch the video about the density of air: http://hypertextbook.com/facts/2000/RachelChu.shtml
- What is the density of the air in each can?
The students were given these dimensions for the cans as the beginning of the study.
The next step is to ask the students to build other cans with different radiuses and height.
The homework will be to build other cans with different dimensions and watch the video.
Check the video about the volume and surface area of a cylinder https://www.khanacademy.org/math/basic-geo/basic-geo-volume-surface-area/basic-geo-volumes/v/cylinder-volume-and-surface-area
SECOND CLASS
The students will have to respond first to the next questions
- What is the area of a rectangle?
- What is the area of a circle?
- What is the surface area of a can (Cylinder)?
- What is the volume of a cylinder?
The students will have to create a spreadsheet like the one below where they will write the radius, height and calculate the volume for the 5 types of cans given at the beginning plus any other cans that were made at home and try to build cans with the same volume as the first 5 cans.
|
|
Can 1 |
Can 2 |
Can 3 |
Can 4 |
Can 5 |
Can 6 (Home) |
Can 7 (Home) |
Can 8 (Home) |
Can 9 (Home) |
Can 10 (Home) |
|
Radius (cm) |
|
|
|
|
|
|
|
|
|
|
|
Height (cm) |
|
|
|
|
|
|
|
|
|
|
|
Volume (cm3) |
|
|
|
|
|
|
|
|
|
|
The students will have to analyse the spreadsheet with all the cans they found that have the same volume as the first 5 types (or very close to it)
11. What is the volume for the cans (is it equal or almost equal)
12. What is the lowest surface area between the types of cans with the same volume?
13. Are there any cans built at home with the same volume as the first 5 types?
14. Represent on a graph the radius (x) vs surface area (y) of all the cans with the same volume
Homework: The students will have to find the dimensions of the radius and height of other 5 cans with the same volume as the first 5 types of cans.
Read: Introduction to Linear Regression: http://onlinestatbook.com/2/regression/intro.html;
How to use Microsoft Excel: Regression analysis - Quadratic Functions: http://campus.mst.edu/physics/courses/1135lab/Tutorials/plotting_with_Excel_regression_quadratic.pdf;
Watch: Introduction to Regression Analysis: https://www.youtube.com/watch?v=TU2t1HDwVuA;
Quadratic Regression Analysis in Excel: https://www.youtube.com/watch?v=kFasmbrDG5I
THIRD CLASS
The regression analysis will be introduced.
The regression analysis will be used in order to find the ecuation of the graph of surface area in terms of the radius of the cans for ten samples.
The slope concept will be reviewed. The rate of change and the average rate of change and stationary values will be introduced.
Watch: Whichever video you think will help you.
Slope and rate of change: https://www.khanacademy.org/math/algebra-basics/core-algebra-graphing-lines-slope/core-algebra-slope/v/slope-and-rate-of-change
Finding the Minimum or Maximum of Quadratic Functions: https://www.youtube.com/watch?v=XScVP0UrN3M
Derivative intuition module: https://www.khanacademy.org/math/differential-calculus/taking-derivatives/visualizing-derivatives-tutorial/v/derivative-intuition-module
Interpreting the slope of a curve exercise: https://www.khanacademy.org/math/differential-calculus/taking-derivatives/visualizing-derivatives-tutorial/v/interpreting-slope-of-a-curve-exercise
Intuitively drawing the derivative of a function: https://www.khanacademy.org/math/differential-calculus/taking-derivatives/visualizing-derivatives-tutorial/v/intuitively-drawing-the-derivative-of-a-function
15. For what radius the surface is the smallest?
16. What do you notice regarding the relationship between the radius and the height for the smallest surface area?
17. Where is the point where the graph has a minimum and how are we going to find it?
Homework: Read at home the resources below:
Minimum Surface Area of a Can: http://jwilson.coe.uga.edu/emt725/MinSurf/Minimum.Surface.Area.html
http://datagenetics.com/blog/august12014/index.html
Why are cans shaped the way they are?: Http://www.wskc.org/documents/281621/281999/ENGAGE_E3S_Calculus_Soda+Can.pdf/a4689f15-0699-4e58-b208-c6a0f89517ac?version=1.0
18. Write a report of what you noticed and your conclusions.
The report is due next class
Evaluation
 RUBRIC
|
|
INCOMPLETE |
COMPLETE |
|
FIRST CLASS |
The formulas are not complete. Just 2 cans built |
The formulas are correct and the number of cans built are around 10 |
|
SECOND CLASS |
The formulas are not correct and the spreadsheet is not completely done |
The formulas are correct and the spreadsheet is completely done |
|
THIRD CLASS |
The graph is not complete with at least 8 points |
The graph is complete with more then 8 points represented |
|
FINAL REPORT and LETTER |
Does not include all the information found during the project |
Does include all the information found during the project. |
Conclusion
 CONGRATULATIONS!!!!!!
YOU SUCCEEDED !!!!
The students had a quest where they had to come up with a raport that explain in as much detail as possible and using the regression analysis and derivatives how they will compute the smallest surface area of the cylinders that have the same volume so they will use the smallest amount of material possible.
Credits
http://hypertextbook.com/facts/2000/RachelChu.shtml
http://jwilson.coe.uga.edu/emt725/MinSurf/Minimum.Surface.Area.html
http://datagenetics.com/blog/august12014/index.html
http://onlinestatbook.com/2/regression/intro.html;
plotting_with_Excel_regression_quadratic.pdf;
https://www.youtube.com/watch?v=TU2t1HDwVuA;
https://www.youtube.com/watch?v=kFasmbrDG5I
The book The Math Olympian by Richard Hoshino
Teacher Page
The project is related to grade 12 math: Derivatives, introduction to concepts and applications
The project has few learning objectives:
- To extend the knowledge about the 3-Dimensional objects and especially cylinders
- To force the students to think outside their comfort zone of pure math to real life problems
- To make students think about knowledge from other subjects like Physics or chemistry
- To review some definitions and formulas regarding previous knowledge about slpoe and rate of change
- To extend the knowledge beyond by introducing and using regression analysis, derivatives, and applications.
- To make everything more fun and interesting by using the Webquest tool.
The methodology used is a practical one by asking the students to build many cylinders that have the same volume but different radiuses and heights. In this way the students will have a better feel and understanding of what they are looking for.
In the end the whole mathematical explanation is given through few websites so the students will be able to write about their understandings in a report.
The knowledge component is helped by the technology by using few websites to help students better understand the mathematical aspect of this real problem.