Introduction
In today's Webquest you will be looking at multiple ways to writing the equation of a line through data points.
Make sure that you have your activity guide!

Work hard today!
As always, I am here to support you, but part of my supporting you is enabling you to guide your own learning. As questions as needed, but I encourage you to look for the answers. You are more likely to remember knowledge gained through your own searching.
Resources (use these if you need extra help today):
Text-based (picture):
http://www.coolmath.com/algebra/08-lines/12-finding-equation-two-points-01
http://www.purplemath.com/modules/strtlneq.htm
Video Based:
https://www.youtube.com/watch?v=-Kk_NfgZALI
https://www.youtube.com/watch?v=u3spOO-m_Gg
https://www.youtube.com/watch?v=_E4dcIGZk_U
Task
Task 1: Writing the Equation of a Line Given a Table of Data with a Starting Value
When given a set of linear data, finding the equation of a line that fits the data means we need both the slope (m) and the y-intercept (b value).
Remember, slope is:

Since we are dealing with linear functions, the slope is ALWAYS the same between ANY 2 points within the data. It is always constant.
Example 1:
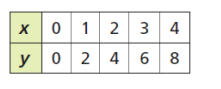
Let's find the slope first. To do this we can pick any two points. I will choose (2, 4) and (4, 8). The slope between these two points is:

m = 2 (or the slope is positive 2 or up 2 over 1 on a graph).
Now, we need a y-intercept. The easiest way to obtain this is to check on our table of values to see if the y-intercept is given. Remember that the y-intercept is found when x equals......ZERO!
On our table of values y =0 when x= 0, so our y-intercept (or b-value) is 0.
Now that we have our m and b values, we can write the equation of the line that passes through the given table of data points.
Our equation is: y = 2x+0 or simply y = 2x
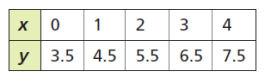
Example 2: Try the following problem on your own. If you would like for me to check your work, raise your hand or quietly compare your work with your neighbor.
Write a linear equation for the following data:
Table for Example 2:
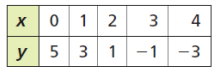
Example 3: Try the following problem on your own. If you would like for me to check your work, raise your hand or quietly compare your work with your neighbor.
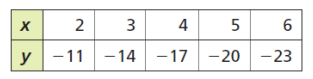
Write a linear equation for the following data:
Table for Example 3:
Task 2: Writing the Equation of a Line Given a Table of Data Without a Starting Value
Another type of problem that I may encounter is writing the equation of a line when the y-intercept is not given. Always keep in mind that points on a table or points given are x and y values found on a line. They are solutions to the equation, so they will work within my equation. I will work through example one with you.
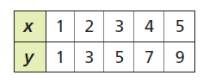
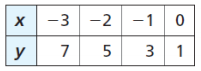
If I have the above data and I'm told to write an equation to model, I first need to check and see if the data is actually linear (or is it increasing or decreasing at a constant rate).

Notice how as x increases by 1, y increases by 2 constantly. This means that the data is linear because it is increasing at a constant rate of change.
Since the data is linear, we can write an equation of the line that fits the data.
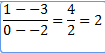
Always begin with finding the slope. Remember that slope is change in y divided by change in x. Pick any two points. I will choose (1,1) and (5,9)
So our slope is:

Our slope is 2 (m=2). Now we need to find our y-intercept or b value. Keep in mind that any of the points in our table of data are solutions to our line. This means that we can plug them into your equation to help us solve for the b-value.
Right now our equation is y=2x+b
Choose a point from our table of value (2,3) and plug it in to your equation 3 = 2 (2) +b
And solve to find your b-value. 3 = 4+b
-4 -4
-1 = b
Our y-intercept is -1.
We know m = 2 and b = -1, so the equation of our line is y = 2x - 1
Example 2:
On your own, test to see whether the table of data is linear. If it is, write the equation of the line that fits the data set.
If you would like me to check your work, raise your hand or quietly compare work with your partner.
Table for Example 2:
Example 3:
On your own, test to see whether the table of data is linear. If it is, write the equation of the line that fits the data set.
If you would like me to check your work, raise your hand or quietly compare work with your partner.
Table for Example 3:
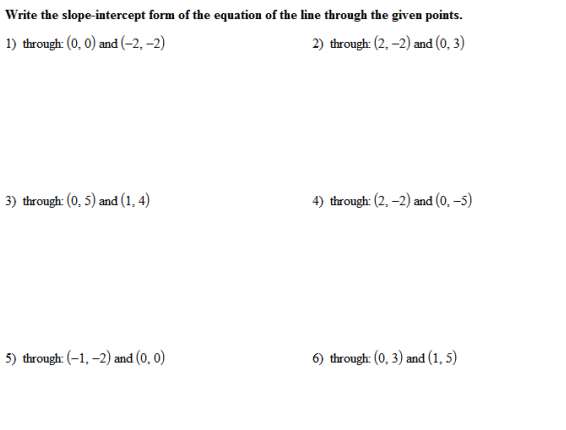
Task 3: Writing the Equation of a Line through Two Points
Your last task today is to write the equation of a line that passes through two points. It is very similar to writing the equation of a line from a table of data.
Since the data is linear, we can write an equation of the line that fits the data.
Always begin with finding the slope. Remember that slope is change in y divided by change in x. Pick any two points.
Example 1:
through (-2, -3) and (0, 1)
So our slope is:
m = 2 and b = ?, to find b, use one of the given points because it is a solution to the equation. (FYI, I know the y-intercept is given in this problem, but I want you to see the steps for finding it when it is not given.)
So my equation right now is y = 2x +b and I want to use the point (-2, -3) so, -3 = 2 (-2) +b
Now solve for b. -3 = -4 +b
+4 +4
1 = b
My y-intercept is 1, so my equation of my line is: y=2x+1
Mastery Problems (Complete the following problems on your activity guide).
Congratulations, you have gained the skills to help you master today's concept. Click on the Process tab for today's skill (linear regressions).
Process
This week we will be looking at what is called Linear Regression Models. They are used to help make sense of and find patterns in real world, which can be quite messy.
Mastery Problem #1:
Below is a table of data showing the average daily sales of ice cream based on the outside temperature. Notice how the data is not EXACTLY linear, but it follows an overall linear pattern.
Suppose that I wanted to find a linear equation to best model this data. To do this I would pick two points from within my data that I strongly feel fall within the linear pattern. I will pick the points (11.8, 185) and (25.2, 630). Write the equation of the line that would model this data. Leave your answers as fractions in simplest form.
To have your calculator compute the fraction in simplest form input the fraction as division. For example, the fraction 120/380 is 120 divided by 380. Enter this and push enter and you will receive a decimal of 0.3157894737...... To turn this into a fraction in simplest form, press the MATH button (under the greenish blue APLHA button) and press Enter twice. Once I do this my calculator puts the above decimal into the simplest fraction form or 6/19.
Use the same steps that we used on the task page to come up with the equation of the line between the given points.
Equation: __________________________
Mastery Problem #2:

Write the equation of the line for the above graph showing the relationship between the number of chapters proofread and the number of typos found. Pick any two points and show your work to receive credit.
Equation: _______________
Mastery Problem #3:

Write the equation of the regression model for the above graph of data showing the relationship between study time in hours and math grade (precent).
Equation: _____________
According to your regression model, what you be your score if you studied 0 hours? ____________
According to your regression model, what you be your score if you studied 6 hours? ____________
Evaluation
Your evaluation for today will be as follows:
4 points (100) - Stayed on task and completed all task and process problems showing all work.
3.5 points (89) - Stayed on task and completed most of task and process problems showing all work.
3.0 points (79) - Struggled to stay on task and completed most of task and process problems not showing work.
2.5 points (69) - Did not stay on task and did not complete task and process problems.
2.0 points (59) - Disruption to others and did not complete tasks for today.
Conclusion
Once you have finished your work for today, log on to Canvas and complete today's classowork (4 problems) and module.

Also, you may work on the E-Portfolio assignment if you complete all other assigned tasks.

I am so proud of you and your work! Tomorrow we'll be looking at regression models through an activity called "Barbie Bungee." Come prepared to work hard and have fun!
Credits
Mrs. Donabo's original work created on September 28, 2015.